I found out that the adhesives I've encountered from time to time that remain tacky and easily moved or removed are called "non-hardening" adhesives. This was after using E8000 glue for a headphone repair today.
You can, depending on your definition of "useful". You can buy a cheap laser pointer, take out its lens, and put it over your camera lens. Tape it onto the lens for a temporary janky version or make a 3d-printed mount for something much better that you can easily take on/off.
I've personally found this little hack useful, but then again I don't have a DSLR and macro lens!
Thanks for making this! I'm very tempted to get one of these to do some ssVEP stuff.
Do you have plans to make a 16-channel (or 32-channel?) board in the future? In my area of research, 32 channels tends to be the recommended minimum for studies.
I'm glad you like it! I actually made an ssvep pong game a while back with this, was kinda hard to play as the paddle was really small but was a cool concept demonstration. I am working on a video for this device to show off its capabilities with more depth as the current video on the site is very old.
With regards to higher channel count, yes I was thinking about this however it will likely not be released for a few months or longer. The firmware/software rules change a lot when you start daisy chaining the ADC so dev time takes long and I need to reincorporate back into these software ecosystems. Hardware config is also a bit different.
Translating a solution from one problem domain to another is called "transfer" in cognitive science. There's some theoretical and empirical work done on the topic of transfer (e.g. https://www.tandfonline.com/doi/full/10.1080/135467808024901...) but as far as I'm aware, there is not a mature "general theory of transfer" that can be computationally implemented. That's still in the fictional "Glass Bead Game" territory. However, you may want to take a look at that literature for broader picture theory on the issue. It's closely related to the fairly vast literature on insight problem solving, which you might be interested in.
The author builds up plots step by step, showing the changes to the plot along the way. It's really great at showing what each element contributes to the final plot.
Not to take away from some of these comments, but the article does not mention anything about casual observation of the eyes signalling mental health issues. The article is highlighting research on diagnosing disorders of the brain using ophthalmological methods (e.g. optical coherence tomography to measure retinal thickness, electroretinography to measure electrical signaling in rods and cones, and angiography to assess retinal vasculature). Apparently, these non-invasive methods may be used as an additional diagnostic tool in diagnosis of a variety of disorders, and may even be early indicators of brain disorders that have not yet manifested themselves in psychological disturbances.
>and may even be early indicators of brain disorders that have not yet manifested themselves in psychological disturbances
It's only a matter of time before someone as unscrupulous as ClearviewAI develops a phrenology tool for identifying psychological disturbances based on "crazy eyes", which will be used extensively by state security services to manufacture suspicion where none is warranted. False positives are a feature not a bug. See, e.g. drug sniffing dogs and [1].
This article will be cited in the marketing material. It will not matter one iota that the research does not actually support that kind of application.
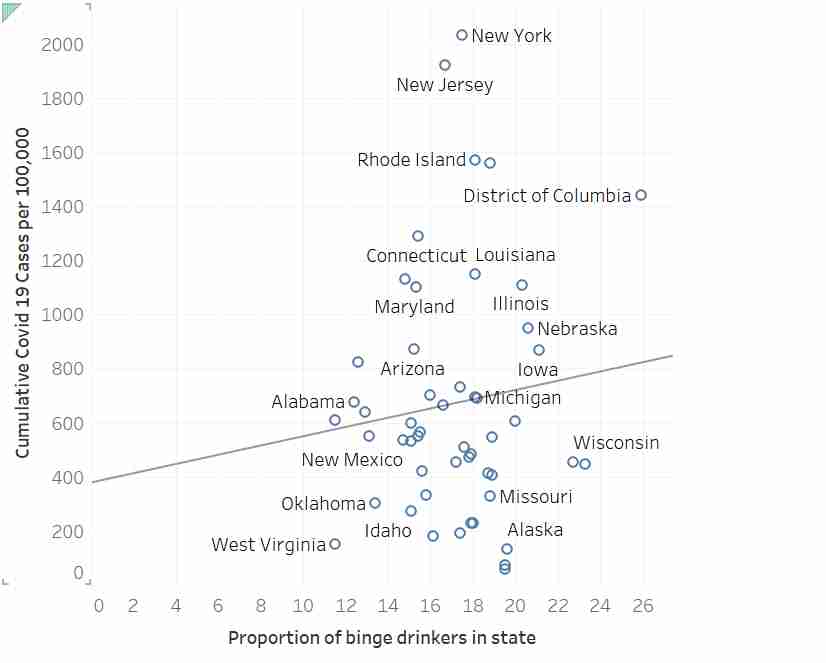
Agreed. I was curious enough to run the model myself so I used a tool to extract the data. The slope estimate (b=17.24) is not significantly different from zero, p=.437.
In case anyone is interested, below is R code to read these data and compute the regression. The summary() reveals the p value for the slope to be 0.437, and that for the intercept to be 0.32.
    d <- read.table("https://pastebin.com/raw/HhWTKZRb", header=TRUE)
    m <- lm(cumulative_covid19_per100000~proportion_binge_drinkers, data=d)
    summary(m)
The problem is that the author is essentially claiming that running the regression for data not passing his eyeball test is, in itself, a misuse of regression...which is nonsense.
I'm not sure I understand your point. Did you actually look at the regression line through the data? It looks crazy off. I'm not a statistician but that line looks like it doesn't represent that data very well at all. People area also saying nuanced comments above but the underlying fact seems to be that this is not a good use of linear regression, and there is no strong correlation between the two axes.
Without access to the residuals, I'd still venture to guess that the assumptions of the regression are not severely violated in this data set.
When this regression is conducted, the null hypothesis is not rejected (regression slope not significantly different than zero). If someone is somehow arguing this regression rejects the null hypothesis, then they would be incorrect. But there is nothing wrong with using regression here. Its kind of the whole point. This is basic regression statistics 101.
Error bands on the regression slope would help people understand the uncertainty of the apparent slope.
Eyeball tests are often misleading, or fail to detect weak correlations (or deviations from model assumptions such as heteroskedasticity). That's why we check with more formal methods.
What are some examples of data sets with high(ish) r with high p (low confidence), and low p (high confidence) with low r?
I guess it would be a very tall, "sharp cornered" parallelogram of data points (clear slope at the average, but high error variation), vs a very short, wide rectangle?